Overlay
Finances

Tracking global trade: how are lockdowns and war affecting supply chains?

World trade expanded marginally in February and March, leading to renewed optimism about the limited impact of new lockdowns in China and the Russia-Ukraine war on global commerce.

Global trade is stabilising despite significant headwinds

Trade growth edged up by 0.3% (month-on-month) in February, making that the fifth straight month of expansion according to the latest data from CPB Netherlands Bureau of Economic Policy. The year-on-year growth rate also showed some stabilisation: 6.5% in February and 6.2% in January (from 7.4% in December). Encouragingly, trade volumes remained above-trend in early 2022.


Trade volumes above long-term trend growth in early 2022

Sources: CPB Netherlands Bureau of Economic Policy, NatWest Markets

Latin America led global trade growth earlier this year (+12.1% in exports alone) followed by the UK (+8%). The former was largely driven by double-digit export growth in Mexico, Brazil, and Argentina; the latter was partly down to operational changes implemented by HM Revenue and Customs in January 2022, and partly a spike in exports across a range of commodities and machinery (chemicals, machinery and electrical equipment, and material for manufacturing). On the other hand, advanced Asian economies like South Korea and Taiwan saw a steep drop in imports. Eastern Europe did record marginal declines in exports and the euro area marginal gains, though it’s important to point out the data below precedes Russia’s invasion of Ukraine.


Global export & import growth in February

Sources: CPB Netherlands Bureau of Economic Policy, NatWest Markets

Global trade is stabilising despite significant headwinds

The war in Ukraine and covid surges across China have reverberated throughout the global economy and confront companies with yet more supply chain disruption. But the impact on global shipping and trade has been nuanced – and more muted than initially feared:

Shipping costs moderated in April across nearly all trade routes: they still remain high when compared with pre-covid levels (8.4 x January 2020 rates for global container shipping) but broadly below peak levels seen in August last year. 

Lockdowns in China may have a more limited impact than feared: for now, bottlenecks appear limited to inland transport and production centres. When we look at the percentage of global container ship cargo capacity tied up due to port congestion, the latest data does show a rise in container ships waiting off Shanghai and neighbouring Ningbo-Zhoushan (the world’s third-largest port), but not to an exceptional degree as was seen during the Wuhan lockdown (early 2020) or last year’s port closures in Shenzhen (June 2021) and Ningbo (August 2021).

Supplier delivery time trends in April appear mixed: amidst raw material shortages, suppliers’ delivery times lengthened in the euro area and US, but the UK saw improvements despite facing the same headwinds (war in Ukraine, lockdowns in China).

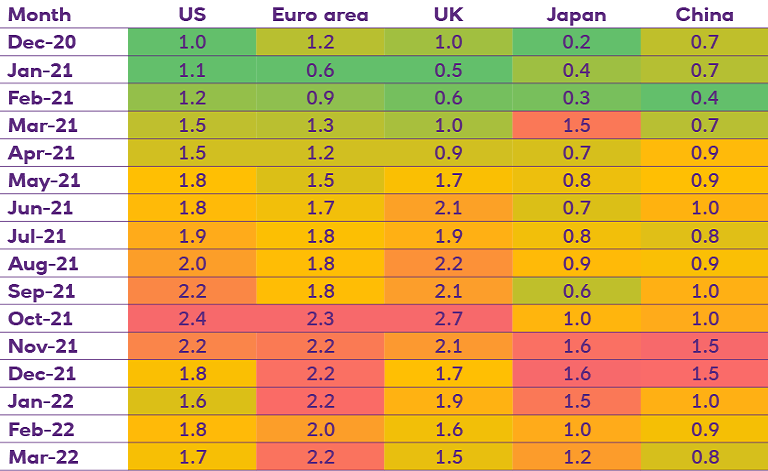
Pressures on European supply chains are beginning to appear: a closer look at the NatWest Markets Regional Supply Chain Index (RSCI) below suggests that supply chains linked to the euro area took a hit in March following Russia’s invasion of Ukraine on 24 February, with the index rising to 2.2 times its long-term average. That rise in supply chain pressures came at a time when other countries saw them ease.


Supply chain pressures intensified in Europe in March due to the war in Ukraine

Sources: National sources, NatWest Markets estimates. Note: Numbers indicate standard deviations from the long-term average; Green shows improvement, while red means intensification of pressures.

Higher oil prices may push supply chain costs higher

Looking ahead, we think the war in Ukraine may have a limited direct impact on logistics and supply chain pressures. But it may translate to higher oil prices in the near term as global sanctions on Russia, the world’s third largest oil producer, continue to bite. Those costs look likely to be passed on to suppliers, putting more pressure on companies globally.

This material is published by NatWest Group plc (“NatWest Group”), for information purposes only and should not be regarded as providing any specific advice. Recipients should make their own independent evaluation of this information and no action should be taken, solely relying on it. This material should not be reproduced or disclosed without our consent. It is not intended for distribution in any jurisdiction in which this would be prohibited. Whilst this information is believed to be reliable, it has not been independently verified by NatWest Group and NatWest Group makes no representation or warranty (express or implied) of any kind, as regards the accuracy or completeness of this information, nor does it accept any responsibility or liability for any loss or damage arising in any way from any use made of or reliance placed on, this information. Unless otherwise stated, any views, forecasts, or estimates are solely those of NatWest Group, as of this date and are subject to change without notice. Copyright © NatWest Group. All rights reserved.

scroll to top