Overlay
Sustainability

Why ESG is helping energy companies improve the bottom line and the environment

It goes without saying that energy companies have a big role to play in the fight against climate change.

Key takeaways:

  • Upgrades to ESG scores are followed by equity outperformance: upgraded companies outperformed significantly, but downgraded firms didn’t see share value drop.
  • Carbon intensity & emission cutting ambitions seem positively linked with credit default swaps (CDS): companies with lower emissions and greater ambitions to cut carbon output saw better credit performance.
  • Policy appears to play a key role defining the relationship between financial performance and emissions: a comparison with a similar analysis of US utilities underscores the role of the Biden administration’s climate ambitions in persuading markets to punish high-emitting firms – but companies shouldn’t wait for policy before acting.

In previous articles, we’ve looked at whether the market has rewarded companies with good (or improving) environmental, governance and social (ESG) behaviours, including within the US utilities sector, financial companies, the oil & gas industry, and corporates more generally. In this article, we wanted to analyse the link between financial performance and ESG for large diversified energy companies – which of course have a relatively large carbon footprint. Let’s take a look at our findings.

Upgrades in ESG scores are followed by share price outperformance

We started off by looking at whether upgrades or downgrades in firms’ ESG scores (MSCI) are followed by outperformance or underperformance of their equities. These ratings provide a good overview of a company’s ESG credentials, so we were interested to see if changes make a difference to how investors allocate their capital to rated companies.

At the same time, it’s important to remember that these upgrades don’t just reflect improvements in firms’ climate strategies and carbon emissions – MSCI ESG ratings also account for factors such as corporate governance and social policies.

We looked at equity performance in the 90 days following a change in ESG score, because over longer periods other factors might drown out the effects of the change in the ESG score – in the short term, there are less likely to be other changes in fundamentals that would affect the firm’s or its peers’ performance.

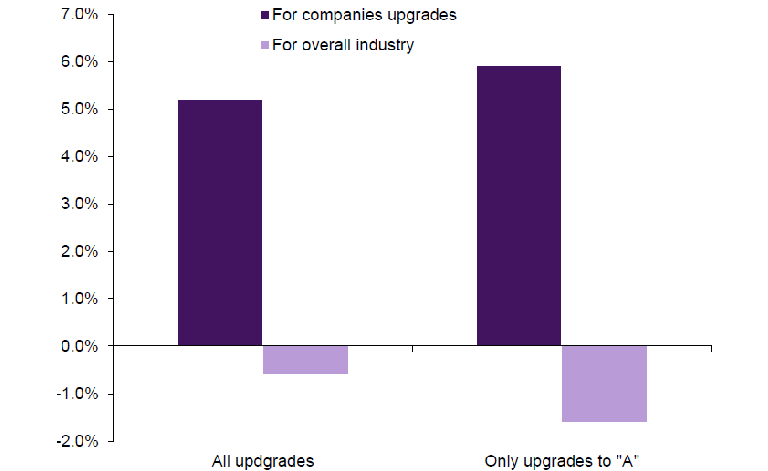
Looking specifically at energy firms with a market cap of at least $1 billion, there have been 19 instances of MSCI ESG score upgrades over the 12 months to the end of July, but only three downgrades over that period. Of the 19 firms that received ESG upgrades, we find that their share prices rose by an average of 5.2% in the three months following the change in rating. By contrast, the market-cap-adjusted industry average return over the same period was -0.6%. In other words, upgraded companies outperformed significantly.
Companies with ESG upgrades outperformed industry peers following the rating change (share prices %)

Companies with ESG upgrades outperformed industry peers following the rating change

Sources: MSCI, NatWest Markets

What about downgrades?

What about the three firms whose ESG ratings were downgraded? Based on our findings above, we’d expect downgraded firms to underperform over the subsequent period. But in fact, we find the opposite is true – they also outperformed.

Taken at face value, this suggests downgrades involve no penalties at all – at least in terms of subsequent equity returns. But it’s important to bear in mind that this sample size (3 downgrades) is far too small to draw any statistically significant conclusions from.

The impact of ESG scores and carbon intensity on CDS spreads

We went on to look at the relationship between ESG scores and credit default swaps (CDS). We found evidence that CDS spreads tighten around the time of an ESG rating upgrade, although the period of analysis is quite wide, and several underlying fundamental factors are likely to be at play.

ESG rating upgrades also had a positive impact on CDS performance

(Basic points)

Sources: Bloomberg, NatWest Markets

Is carbon intensity actually a better predictor of CDS spreads than ESG ratings? We looked at the relationship between companies’ Bloomberg carbon intensity score and their current five-year CDS spread to find out. Even comparing levels at one point in time should reflect some of the future costs associated with dealing with greater carbon burdens, which should at least indirectly be reflected in differentials in market-determined creditworthiness.

Bloomberg’s carbon intensity scores provide a good indication of the efforts being made by companies to improve their carbon footprint. The score evaluates firms in terms of both their current and predicted carbon intensity, which is benchmarked against third-party providers. The forecast component, which makes up 75% of the score, should be especially helpful in assessing the overall cost of internalising carbon costs for companies, at least on a comparative basis.

On a scale of 1–10, with 10 representing the best score with the lowest carbon intensity, the average score was 4.65. We split the sample (26 companies) into three groups: top (one standard deviation above the average), bottom (one standard deviation below) and the remainder as a control group and we found the best performers (those with a carbon score above 7.5) on average have a five-year CDS spread of 57bp, compared with 75bp for the control group and 80bp for the worst performers. This would suggest there is a link between lower carbon intensity and better credit performance, with the opposite also holing true.

Lower carbon intensity is roughly correlated with tighter CDS spreads

Sources: Bloomberg, NatWest Markets

While there appears to be a link between carbon intensity and CDS spreads, the 23bp spread differential between the best and worst carbon performers seems very low considering the potential differences in the cost of carbon between the two groups. We also found some clear outliers within our groups, with firms with very different carbon scores trading at very similar spreads.

Comparisons with other sectors highlight the importance of policy

Overall, we found a weaker relationship between ESG credentials and financial asset prices in the energy sector than we did when looking at US utilities. This could be because of President Biden’s ambition that US electricity producers should be producing zero net emissions within 15 years, with the result that the market is already very clearly selecting winners and losers based on companies’ current carbon footprints as well as their planned future actions to reduce their emissions.

However, the relationship for energy companies seems to be much stronger than for firms in the financials sector, where we found very little link between ESG scores and asset performance. It seems intuitive that ESG criteria currently have a less impact role in determining asset returns for financials than they do for energy and electricity companies.

Going forward, we believe that future policy actions are likely to provide markets with better guidance on how to price carbon risks. We’ve seen that in the US electricity sector, where net-zero targets have provided a clear benchmark to work against, and the market was quick to react as soon as it was implemented. But in some instances – as we’ve seen in the food industry, for instance – public pressure has been enough to make markets respond without government intervention. Either way, it’s crucial that companies stay one step ahead on ESG, given the implications on financial performance, and the evolving expectations of regulators and customers as the race towards net-zero hots up.

scroll to top