Overlay
Finances

Trade V-Covery: will supply chain bottlenecks scupper a trade recovery?

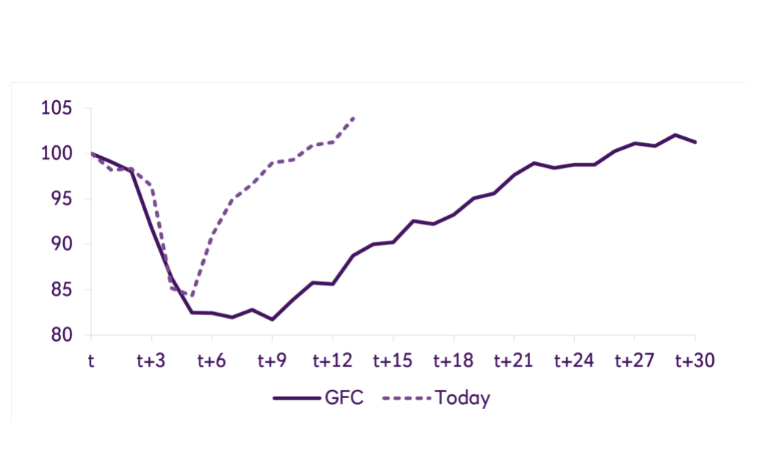
Global trade continued its impressive recovery in the early months of 2021 but risks still weigh on the outlook as many countries continue to reopen. 

Key takeaways:

  • Global trade is now 3.4% above pre-pandemic levels: the highest level since October 2018.
  • East Asia – led by China – is winning new trade market share: work-from-home and medical products drove export expansion, while an early lead on battling the pandemic buoyed broad import demand.
  • Supply chain bottlenecks could delay the recovery: shipping capacity bottlenecks & slower deliveries highlight the need for corporates to prioritise active supply chain management.

Global trade edged above pre-pandemic levels in 2020 and continue to improve

With the further economic improvement in December, global trade volumes fell by just 5.3% last year according to the latest figures from the CPB Netherlands Bureau of Economic Policy. Volumes increased by 0.6% month-on-month in December, slower than the improvement of 2.1% in November – but still lifting trade volumes to 1.3% above the pre-pandemic levels.

Global trade volumes continued to expand in January 2021, increasing by 2.6% compared to December. World trade volumes are now 3.4% above pre-pandemic levels and the highest since October 2018.

Notably, as the chart below shows, trade took just 11 months to recover from the outset of the pandemic, versus 26 months from the beginning of the global financial crisis (GFC).

V-shaped trade recovery: coronavirus vs. GFC

Sources: CPB Netherlands Bureau of Economic Policy, NatWest Markets. Note: Aug-08 = 100 (GFC), Dec -19 = 100 (coronavirus pandemic). On the X-axis, ‘t+n’ reflects the number of months after the GFC or coronavirus pandemic began.

East Asia is the clear winner – led by China

As global trade recovered from the grip of pandemic, Asian economies captured an increased share of both imports and exports. The biggest beneficiaries last year were East Asian economies led by China, which gained 1.5% and almost 1% of global export and import market share, respectively, in 2020. Perhaps unsurprisingly, work-from-home and medical products drove export expansion, while an early lead on battling the pandemic (and easing related restrictions) buoyed broadly-based import demand. As the chart below shows, other East Asian economies also emerged as winners in gaining global trade market share. The US also benefitted from increased demand for protective gear and stay-at-home products, which drove strong import gains.

Changing global trade market share (2020 vs. 2019)

Sources: National Statistics, NatWest Markets.
China’s momentum continued through the first months of 2021. Exports grew by 60.6% year-on-year in January and February, while imports grew by 22.2% during the same period, reflecting high demand from developed markets like the US, Europe & Australia.

The trade recovery is on track heading into Q2 – but corporates should mind supply chain bottlenecks

Data from several countries suggest export demand remained resilient in early 2021. Outperformance of East Asian economies is still evident, and survey data suggest that export orders from developed markets improved further, reaching a three-year high in February. The global manufacturing PMI’s new export orders, a leading indicator of trade volumes, increased to 51.5 in February, above the breakeven level of 50, and the Container Throughput Index, which reflects trade through global ports, continued its rise in February despite lockdowns.

But supply chain disruption risks weighing on trade. Even before the late-March grounding of a large container ship in the Suez Canal, a vital global trade thoroughfare, the suppliers’ delivery times index of the manufacturing Purchasing Managers Index (PMI), a broad reflection of supplier sentiment, dropped sharply in the US, the Euro area and Japan in February, implying longer lead times for delivery of goods (see below).

Supplier PMI: shipping capacity is struggling to keep up with demand

Sources: IHS Markit, NatWest Markets.

In the UK, which left the EU single market and began trading under a new UK-EU Trade and Cooperation Agreement (TCA) at the start of the year, near-term frictions in goods trade are increasingly apparent with rules of origin requirements piling on costs & administrative burdens for corporates and disrupting supply chains. The UK’s overall trade declined by 21%  month-on-month in January, as both exports and imports declined by almost a fifth, but  there was a sharp decline in UK-EU trade (-33.2% month-on-month). Indeed, UK exports to the EU declined by 40.5% in January, in contrast to exports to non-EU countries, which increased by 3.6%.

Ultimately, the recovery in the coming months will depend on how quickly pent up demand for goods meets rising vaccine distribution & easing restrictions. Yet the latest figures also highlight the importance of active supply chain management to help manage anticipated & unforeseen events.

The last year has taught us that the resilience and reliability of supply chains is incredibly important. Corporates should be looking to achieve as much visibility and transparency of their supply chains as possible – both suppliers and suppliers of suppliers – to help identify & understand risks to disruption, and map supply chains end-to-end. Only then will businesses be in a position to assess and mitigate these risks. 

Where bottlenecks may emerge as the recovery proceeds is difficult to predict. Huge pent-up demand may indeed outstrip supply as more economies start to emerge from lockdown, but the asymmetries in regional and national progress on tackling the pandemic further underscores the importance of careful planning.

Thanks to Aastha Gupta for their contribution to this publication.

scroll to top